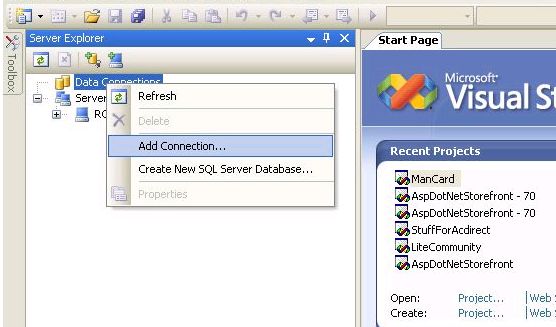
The first thing you want to do is add a data connection in the Visual Studio 2005 Servers windows. Right click on "Data Connections" and click on "Add New Connection":
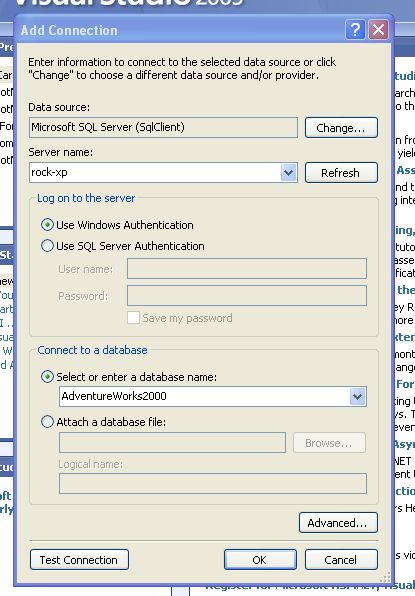
Enter the required connection info in the "Add Connection" dialog and click "Test Connection" to test the connection. If that succeeds, click OK:
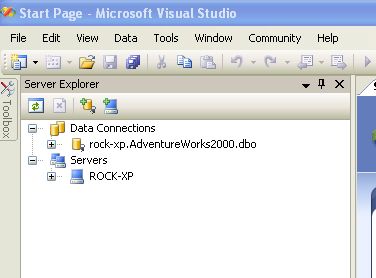
After you add the data connection you will be able to see the connection in the Data Connections tree:
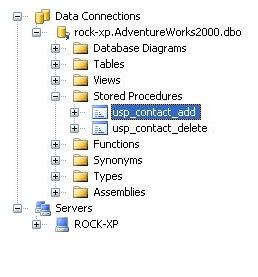
We're going to debug "usp_contact_add" in this example (any proc will do, it really doesn't matter what proc YOU use). Drill down until you can see the proc you're debugging under the "Stored Procedures" folder:
Right click on the proc and click "Open". You will see the proc code in the code window:

"Now we debug"
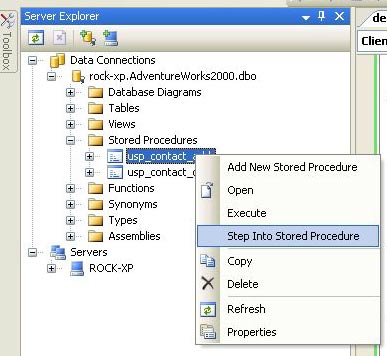
Now that we've figured out how to open the proc we're going to get into actually debugging it. Right click on the proc and click "Step Into Stored Procedure":
A window with all of the parameters for the proc will pop up:
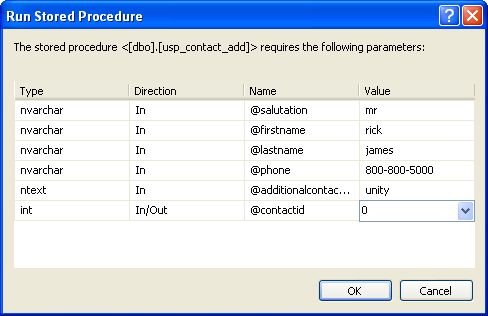
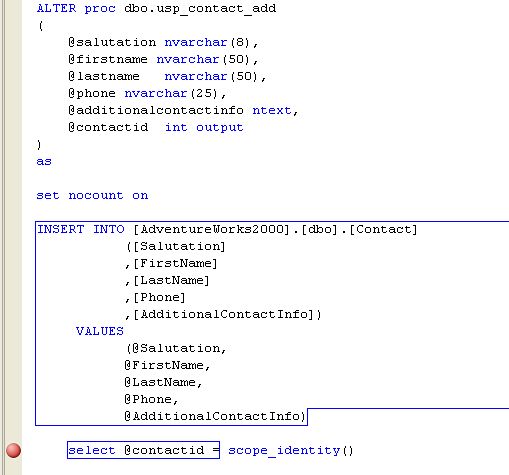
Notice it says "The stored procedure ... REQUIRES the following parameters:" That means you are REQUIRED to fill in the values. Otherwise the debugger will quit right away. That said; click the OK button to step into the procedure. The debugger will automatically stop execution on the first line of code in the stored procedure. When the debugger has stopped execution you'll see a yellow arrow to the left of the line of code:
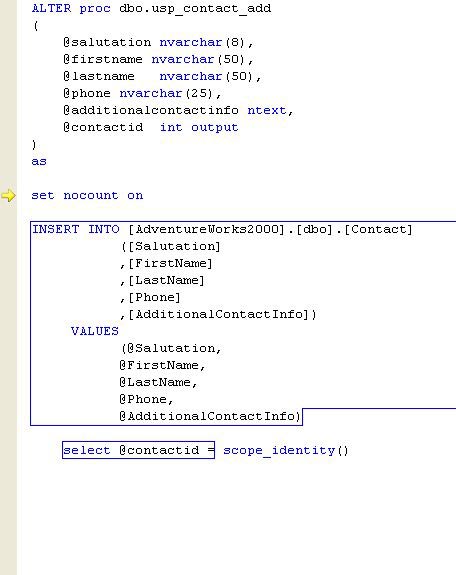
Depending on how you have your Visual Studio settings you will click either F8 (VB) or F11(C#) to go to the next line of code. The debugger will execute the previous line of code and move to the next line:
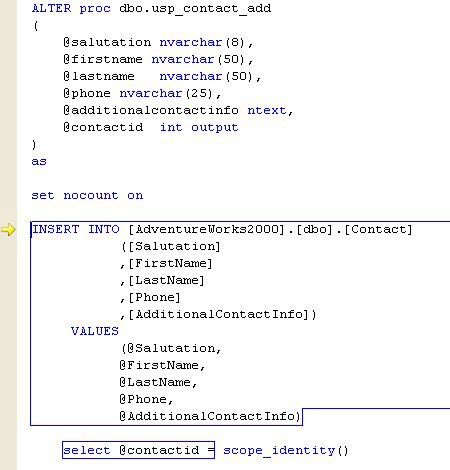
Now "nocount" is "set" to "on". Click F8 or F11 again and the insert statement (or whatever line of code the yellow arrow is pointing) will be executed.
Ok... So can we doing anything except watch the debugger work?
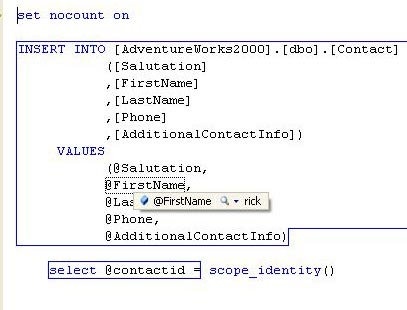
Yes, in fact there are several things you can do but I'm going to concentrate on what I use most in VS2005 while debugging stored procedures.While you're debugging you can view / edit the value of the variables in scope using a few different methods. The first way to view/edit a variable is simply hovering your mouse over the variable:
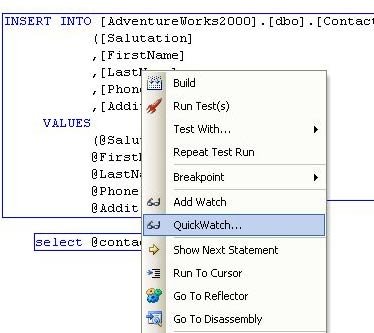
The next way to view/edit the variable is using watches. The first type of watch is the "Quick Watch". A quick watch simply shows you the value in its current state. Right click on the variable and click "Quick Watch":
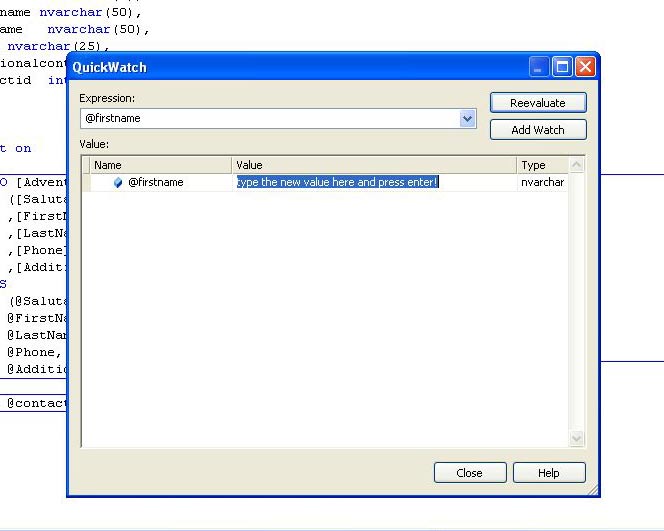
The quick watch window will be displayed:
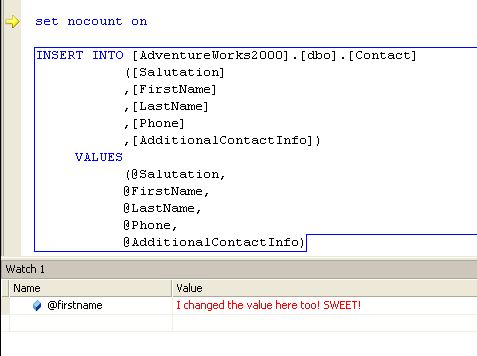
The second type of watch is the "old school" watch using the "Add Watch" option. Right click on the variable and click "Add Watch". Clicking "Add Watch" will add the variable to the watch window. If you don't see the watch window press CTRL + D, W to bring it into focus.
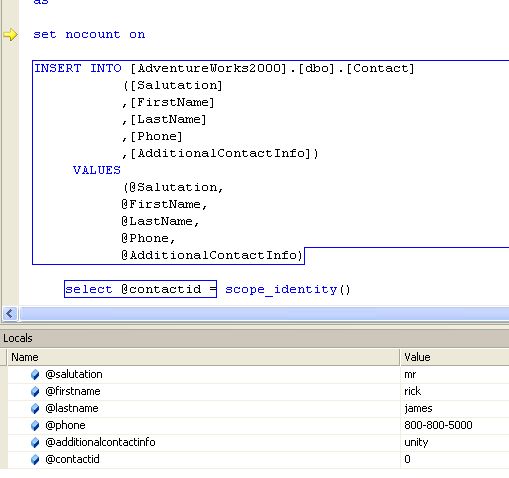
The third way of viewing / editing the variables is the locals window...my favorite! (CTRL + D, L). This window will list all of the variables and their associated values:
If you're feeling adventurous you might give the immediate window (CTRL + D, I) a try.
I love breakpoints, you love breakpoints, If we didn't use breakpoints, we'd be lame.
(Note: The above title is set to the "Cheesy Poofs" theme song from South Park episode 211)
Another cool feature while debugging procedures is breakpoints. If you don't want to deal with stepping through each line of code to get to the problem code you can add a breakpoint. A breakpoint will stop execution at the line of code the breakpoint is set on while the debugger is active. This is invaluable when debugging a really large procedure or the last DBA's code. We all know the last DBA didn't know what they were doing!
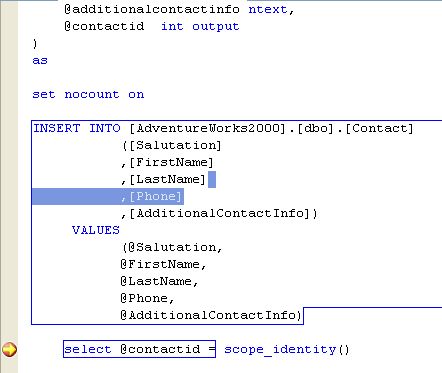
To add a breakpoint click on the line of code where you want the breakpoint and press the F9 key. After you press F9 you should see a red "ball" to the left of code where the breakpoint was set:
Now we want to execute the procedure and hit our breakpoint. Right click the code window and click "Step Into Stored Procedure". Again, fill in the data in the parameters window and click OK. The debugger will again stop on the first line of code. Click F5 to tell the debugger to start running again. The debugger will now stop execution at the breakpoint:
There you go. Getting through all of the code you don't want to execute manually is as easy as pressing F9 (<< That sets the breakpoint).
(Note: Pressing F5 while the debugger is active will execute the stored proc until it: 1) hits a breakpoint. 2) Exits the proc.)
No comments:
Post a Comment